
Case Study
Business Intelligence Dashboard
One live view of the business — KPIs, sales, marketing and customer analytics.
Client
[CLIENT NAME]
Industry
[INDUSTRY]
Project Overview
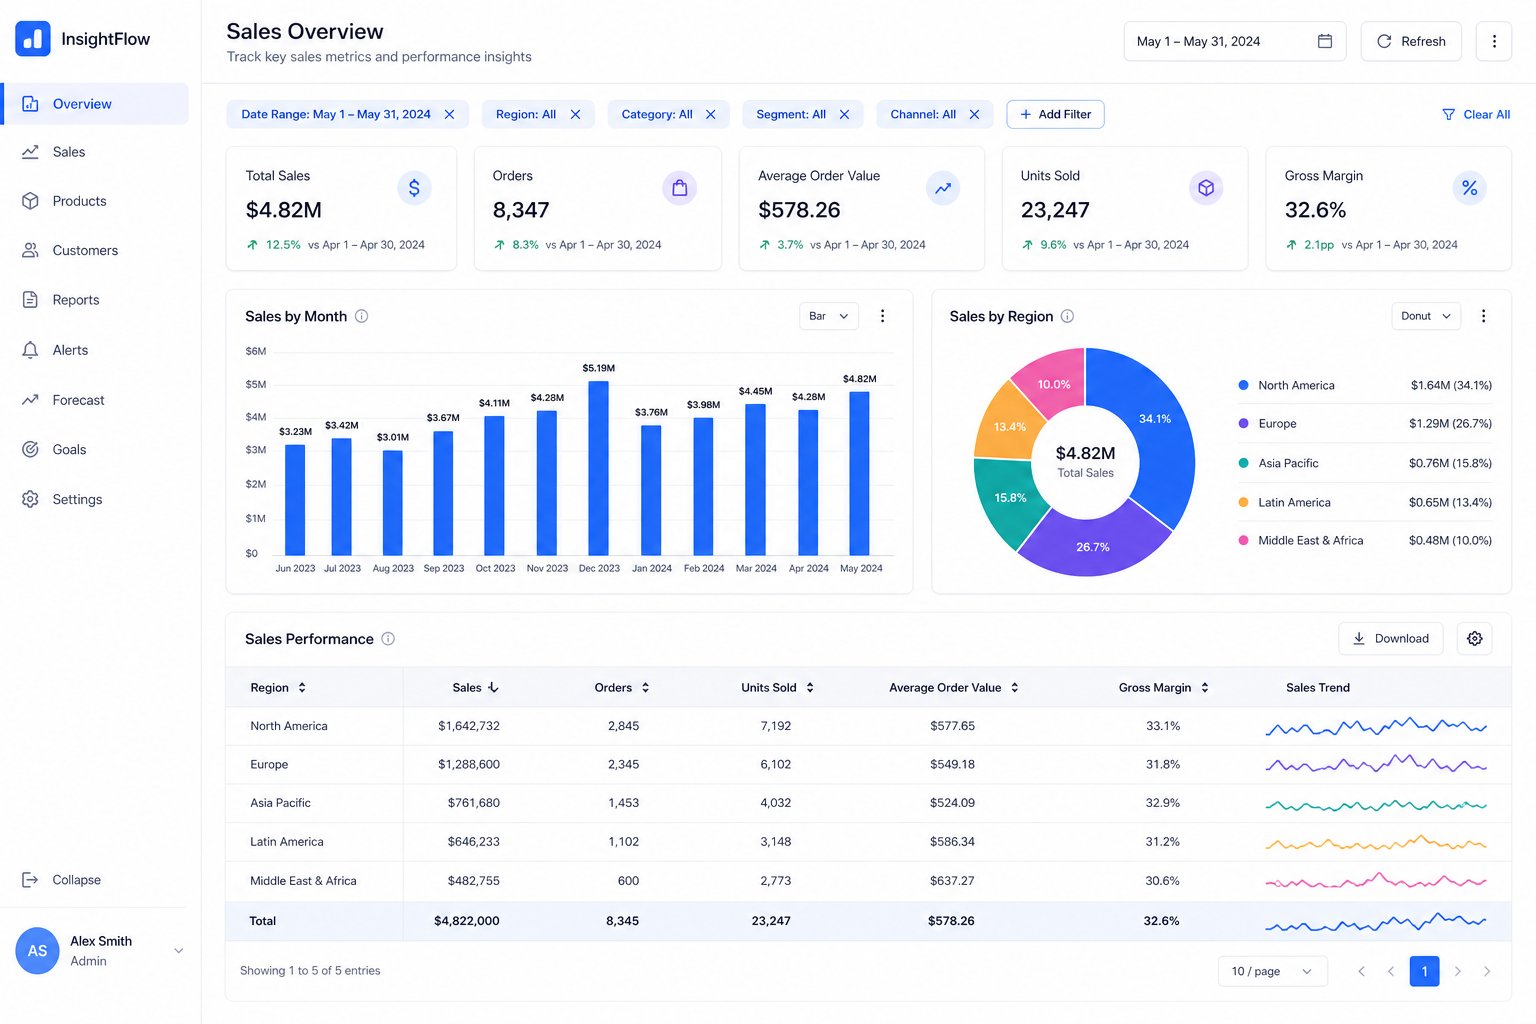
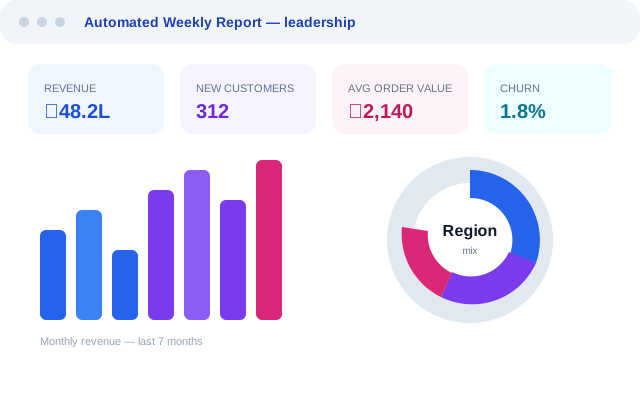
A business intelligence layer that consolidates data from sales, marketing and operations into interactive dashboards and automated reports — replacing hours of manual reporting with a single live view of performance.
The Challenge
[BUSINESS CHALLENGE — e.g., data scattered across tools and decisions made without a shared view of performance]
Our Solution
We consolidated the data sources, modeled the KPIs with the leadership team, and built interactive dashboards with automated reporting so every decision starts from the same trusted numbers.
Services Used
- Business Intelligence
- Data Visualization
- KPI Tracking
- Automated Reports
- Business Dashboards
Technologies
- Python
- Pandas
- SQL
- Power BI
- PostgreSQL
Implementation
- 1
Discovery: KPIs, data sources and reporting cadence
- 2
Data modeling and pipeline setup
- 3
Dashboard design and build
- 4
Automated reports and alerts
- 5
Training and adoption with the leadership team
Project Screenshots
Results & Impact
- [RESULTS — e.g., hours saved per week on manual reporting]
- [RESULTS — e.g., faster decision cycles]
- [RESULTS — e.g., single trusted source of KPIs]
Keep exploring
Related Projects
Other projects that share the same services.
Have an idea? Let's build it.
Whether you're launching a startup, automating your business or scaling your digital presence, KAALAMITHRA can help turn your idea into an actionable technology solution.